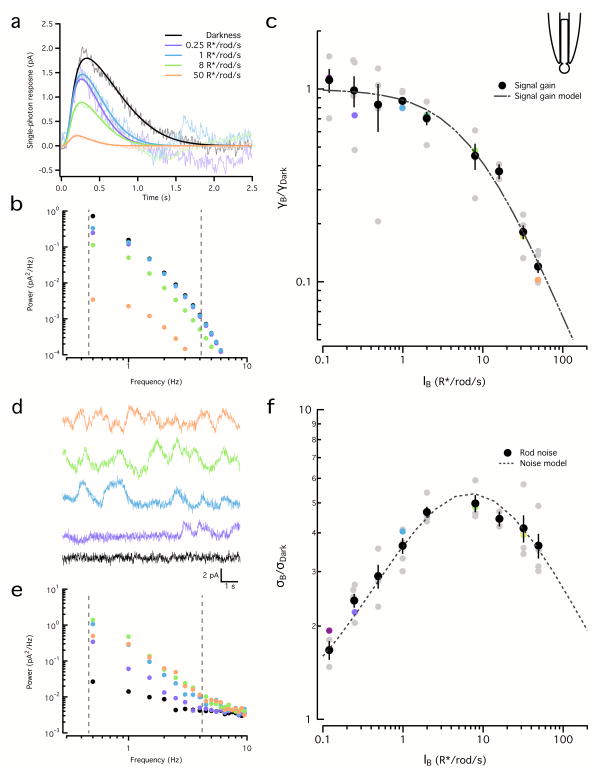
Figure 5. Adaptation similarly affects rod signal and noise.
a. Linear estimates of the rod single photon responses for a range of backgrounds. Increasing backgrounds resulted in faster and smaller responses. Fits were obtained using Equation 6. Correspondence between light levels and color scale is maintained throughout the figure.
b. Power spectra of the fitted single photon responses in (a). Dashed lines show integration limits.
c. Square root of the integrated signal power (0.5 Hz–4 Hz) normalized by that in darkness for the example rod in (a) and (b) (colored circles) and for a population of rods (gray circles). The population data (black circles, mean ± SEM, n=5) was fit with Equation 1 with I0 = 7.1 R*/s.
d. Examples of noise traces for the same rod and backgrounds as in (a).
e. Power spectra of the noise traces in (d). Dashed lines show integration limits.
f. Square root of the power spectrum integral (0.5 Hz–4 Hz) of the noise normalized by darkness for the example rod in (a) and (d) (colored circles) and for a population of rods (gray circles). The population (black circles, mean ± SEM, n=5) was fit with Equation 2 with ID = 0.062 R*/s.

