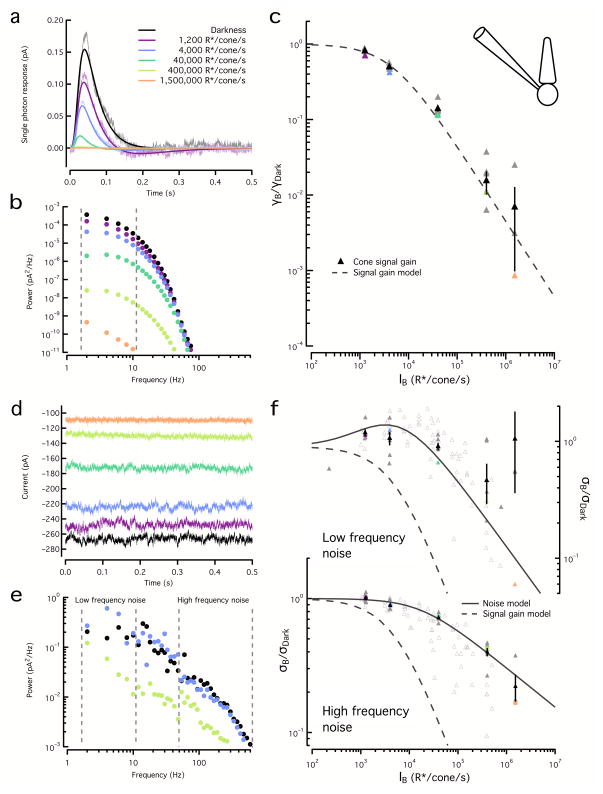
Figure 6. Adaptation affects cone signal and noise differently.
a. Estimated cone single photon responses for a range of backgrounds, fit with Equation 6. Color scale is maintained throughout the figure.
b. Power spectra of the fitted single photon responses in (a). Dashed lines show integration limits.
c. Square root of the integrated signal power (2–10 Hz) normalized by that in darkness for the example cone in (a) and (b) (colored triangles) and for a population of cones (gray triangles). Population data (black triangles, mean ± SEM, n=6) was fit with Equation 1 with I0 = 4500 R*/s.
d. Example noise traces for the same cone and backgrounds as (a).
e. Example noise power spectra for the same cone as (a).
f. Top, Square root of the integrated noise power at low frequencies (2–10 Hz) normalized by that in darkness for the example cone in (a) (colored triangles) and for a population of cones (gray triangles). Dashed line shows signal gain curve from (c). Noise below 10Hz at the highest backgrounds (black open triangles) was unreliable and was excluded from fitting. Population (black triangles, mean ± SEM, n=6) was fit with Equation 3 with ID = 620 R*/s. Bottom, Square root of the integrated noise power at high frequencies (50 Hz to 600 Hz) as in top panel. The population data was fit with Equation 7 with Io=17500 R*/s and η=0.29. Open grey triangles show noise from cones in which signal adaptation was not assessed (n=6); fit to low frequency noise used ID=1200 R*/s and I0=9950*/s and fit to high frequency noise used Io=13 360 R*/s and η=0.34.

