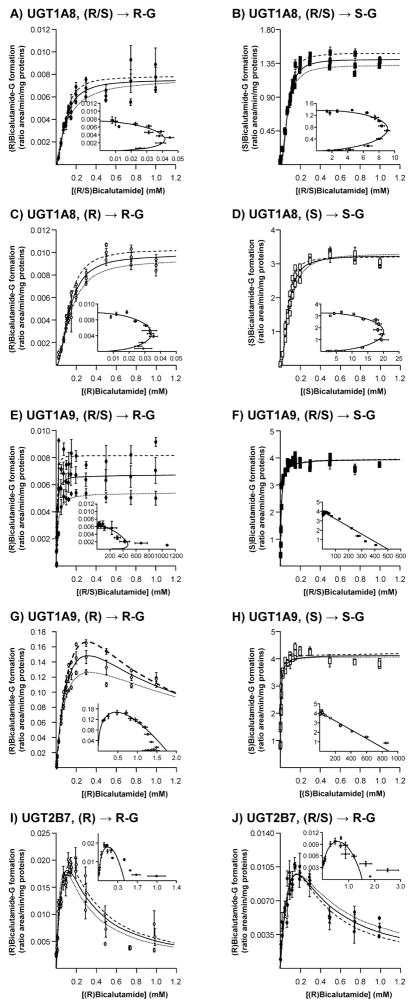
Figure 6. Dose-response and kinetic analyses of bicalutamide enantiomers conversion into their respective glucuronide conjugates by bacculosomes expressing UGT2B7, UGT1A8 and UGT1A9.
UGT1A8 (A–D), UGT1A9 (E–H) and UGT2B7 (I and J) bacculosomes (10 μg) were incubated in the presence of increasing concentrations (1 to 1000 μM) of the racemic (R/S) mixture of bicalutamide (R/S, A, B, E, F and J), or of the pure (R) (R, C, G and I) or (S) enantiomers (S, D and H) and UDPGA (1 mM) for 2 hours at 37°C. The formation of (R)bicalutamide-glucuronide (R-G, A, C, E and G) and (S)bicalutamide-glucuronide (S-G, B, D, F and H) was analyzed by LC-MS/MS. For each panel, large graphs represent the rate of product formation (Y-axis) versus substrate concentration (X-axis) of 2 experiments performed in triplicates (Experiments 1: ·········· and 2: - - - - -) and their mean ( —— ); while small graphs correspond to the mean Eadie-Hofstee plots (rate of product formation (ratio area/min/mg proteins) versus rate of product formation/substrate concentration (ratio area/min/mg proteins/mM).
G: glucuronide.

