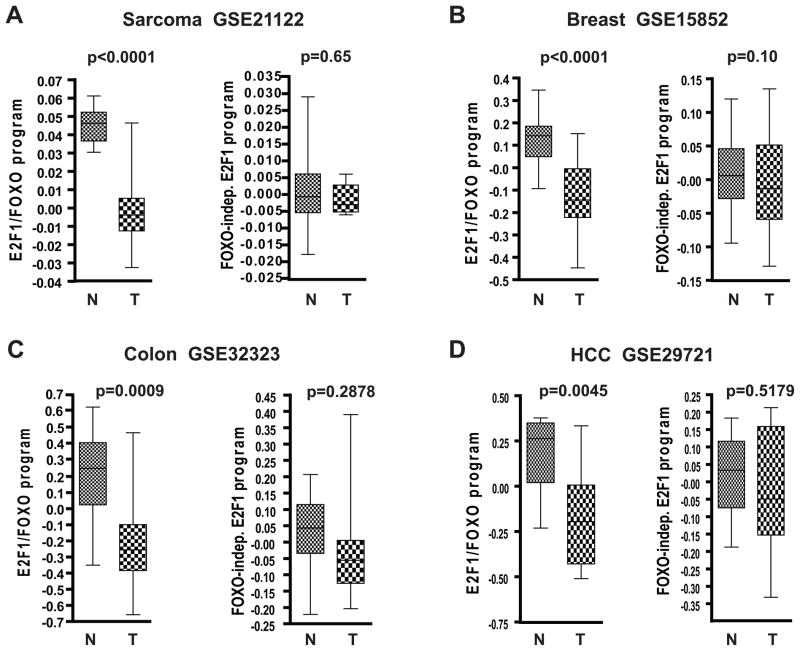
Figure 4. Inactivation of E2F1/FOXO transcriptional program is observed in multiple cancer types and associates with poor prognosis.
E2F1/FOXO targets in the ER-E2F1 microarray analysis were defined as probes induced at least two fold by OHT in sh-scr samples, whose fold induction by OHT was attenuated at least 1.5-fold by shFOXO (Table S3). FOXO-independent E2F1 targets were defined as probes induced at least two fold by OHT in sh-scr samples, whose induced levels did not differ by more than 10% between sh-scr and sh-FOXO samples (Table S4).
The box shows 25th percentile to 75th percentile with a line at the median. The whiskers indicate the highest and the lowest values. In the analysis of matched tumor and normal samples from the same individual we used paired t-test to calculate the significance of the differences in expression. For unmatched samples Mann-Whitney test was used for p-value calculations. N-normal, T-tumor.
A. Analysis of 149 sarcomas and 9 normal fat samples
B. Analysis of 43 matched pairs of breast tumors and normal samples
C. Analysis of 17 matched pairs of colorectal tumors and normal samples
D. Analysis of 11 matched pairs of hepatocellular carcinomas (HCC) and normal liver samples

