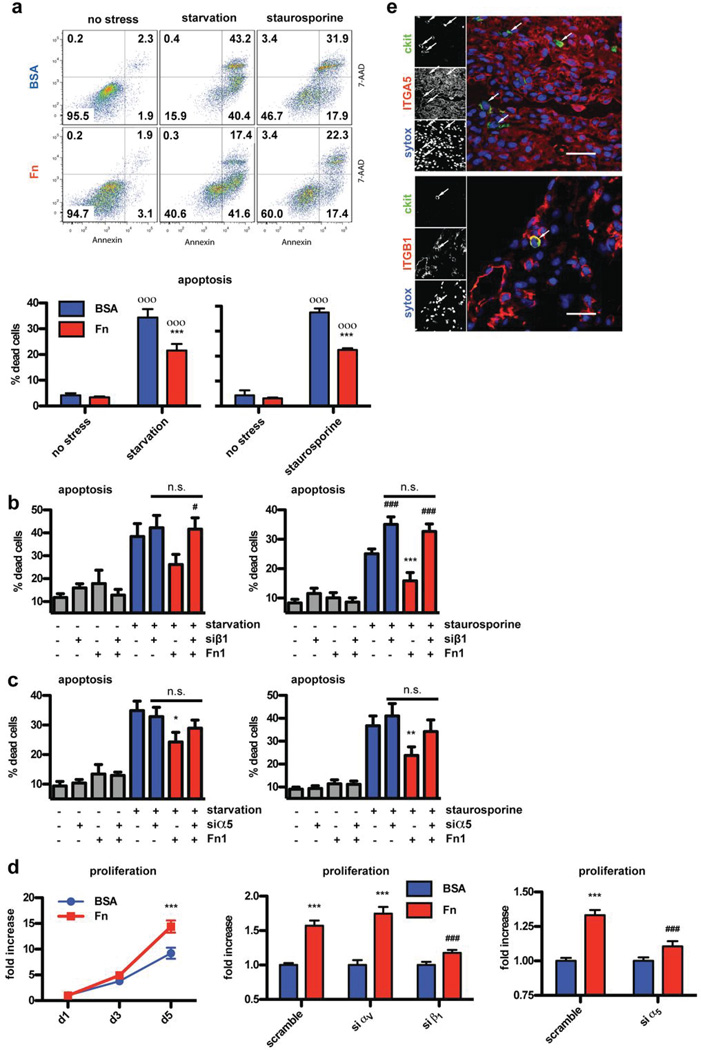
Figure 5. Fn induces protection and proliferation via α5β1 integrin.
Cell death quantified by flow cytometric detection of annexin and 7-AAD staining upon starvation and staurosporine treatment. (a) showing an example FACS dot blot (top) and quantification of n=7 or 4 independent experiments (bottom). siRNA knockdown of β1 (b) and α5 (c) integrin blunts Fn induced protection. n=5–9. (d) Fn induces proliferation of CPCs, which is blocked by siRNA knockdown of β1 and α5 but not αV Integrin. n=5–6 in triplicates each experiment. (e) Immunohistochemistry confirming β1 (ITGB1) and α5 Integrin (ITGA5) expression on CPCs in vivo. Depicted are two specimens from wild type mice 7 days post MI. Scale bar: 30 µm. *: p<0.05; **:p<0.01; ***: p<0.001 compared to BSA. #:p<0.05; ###:p<0.001 compared to scramble. o:p<0.05; oo: p<0.01; ooo: p<0.001 compared to no stress.

