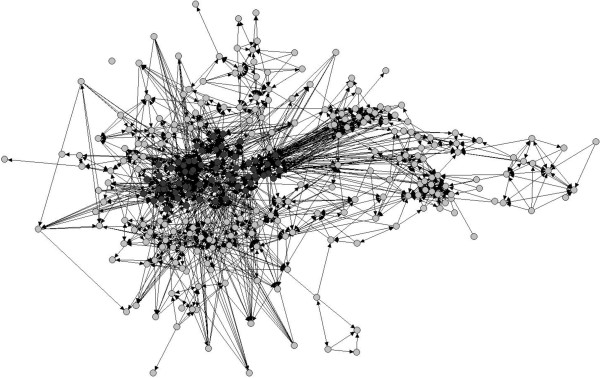
Figure 1.

Sociogram of the professional network among physicians. Legend: Number of nodes = 297; Number of ties = 1,473; Network density (proportion of existing ties relative to the number of possible ties) = 5.7%. Dark gray circles represent physicians who are part of the network core and light gray circles are clinicians who belong to the network periphery.
