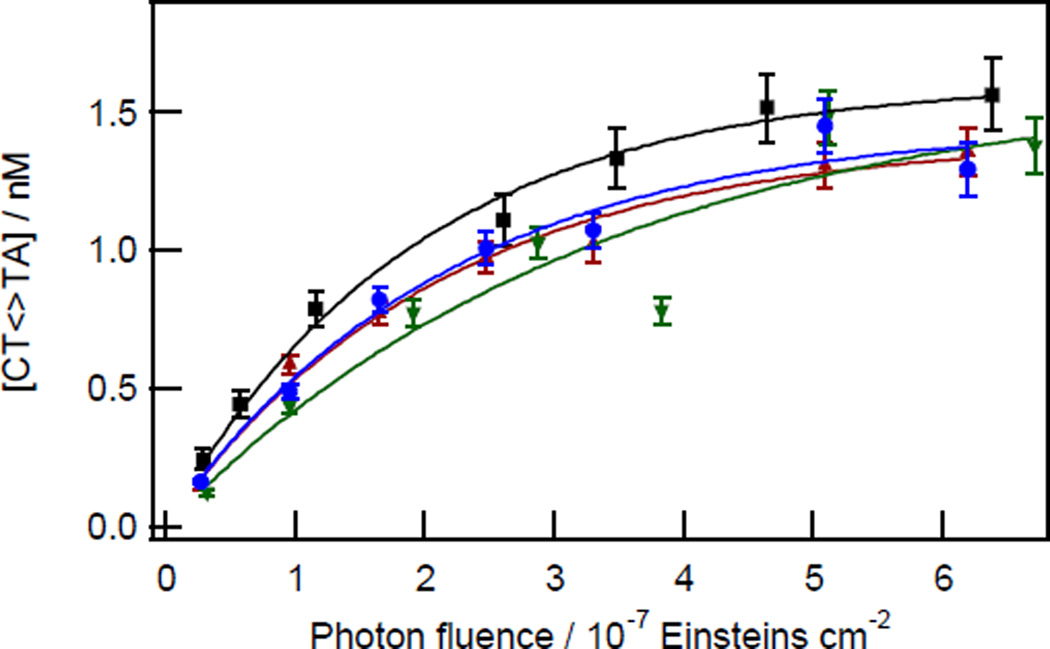
Fig. 3.
Kinetics of TT CPD formation for CTTA tetrads at Cy5–34 (black squares) of the MP2+50 duplex and at the following sites on the 5S+50 duplex: Cy5–34 (blue circles), Cy5–182 (green downward triangles), Cy3–105 (red upward triangles). Solid curves are fits to points of the same colour using equation 2.

