Fig. 1.

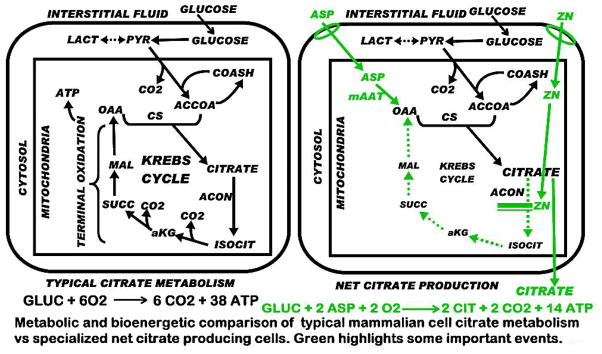
Comparison of typical mammalian cell citrate metabolism and the metabolic pathway for net citrate production. Green highlighting represents important changes associated with net citrate production.

Comparison of typical mammalian cell citrate metabolism and the metabolic pathway for net citrate production. Green highlighting represents important changes associated with net citrate production.