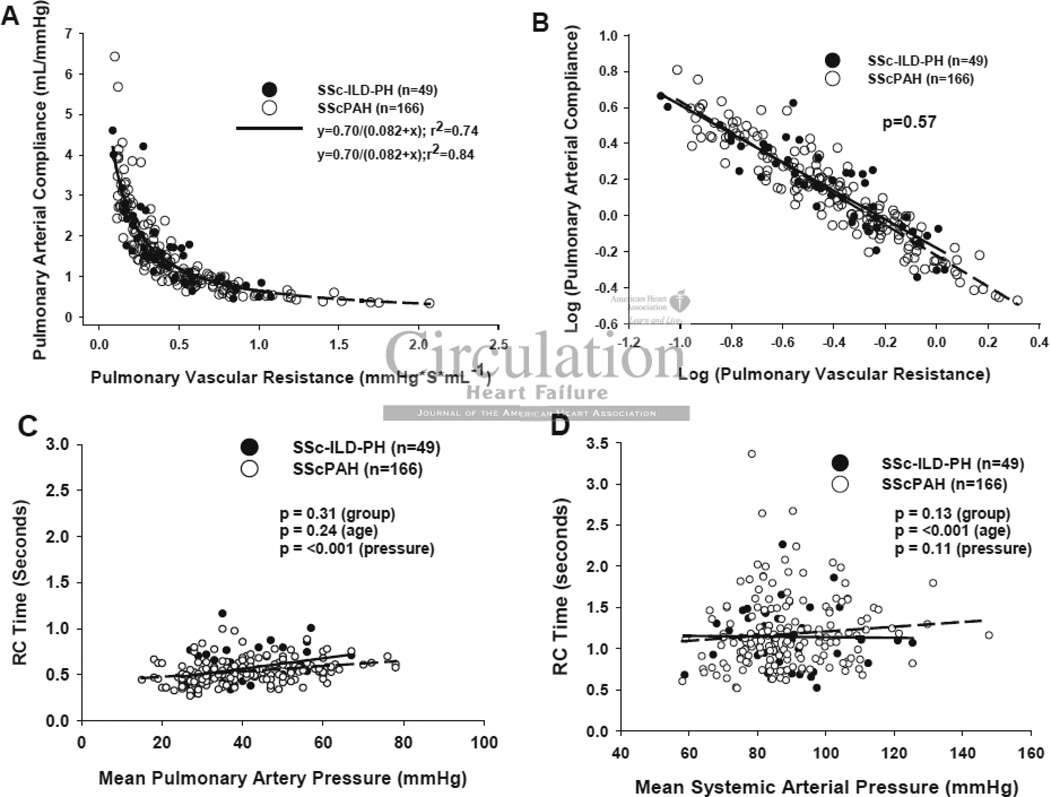
Figure 3.
Pulmonary Vascular Resistance-Compliance Relationship. A) RPA vs. CPA in SScPAH (n=166) or SSc-ILD-PH (n=49). Data are fit by non-linear regression, and best fit curves given by CPA=0.70/ (0.082+RPA) and CPA=0.70/ (0.082+RPA), respectively. B) Log(RPA)-Log(CPA) plot shows overlapping data between groups (p=0.57 for group effect by analysis of covariance). C) Product of RPAxCPA for pulmonary or D) systemic vascular system, each plot versus respective mean pressure for patients in both SScPAH and SSc-ILD-PH.

