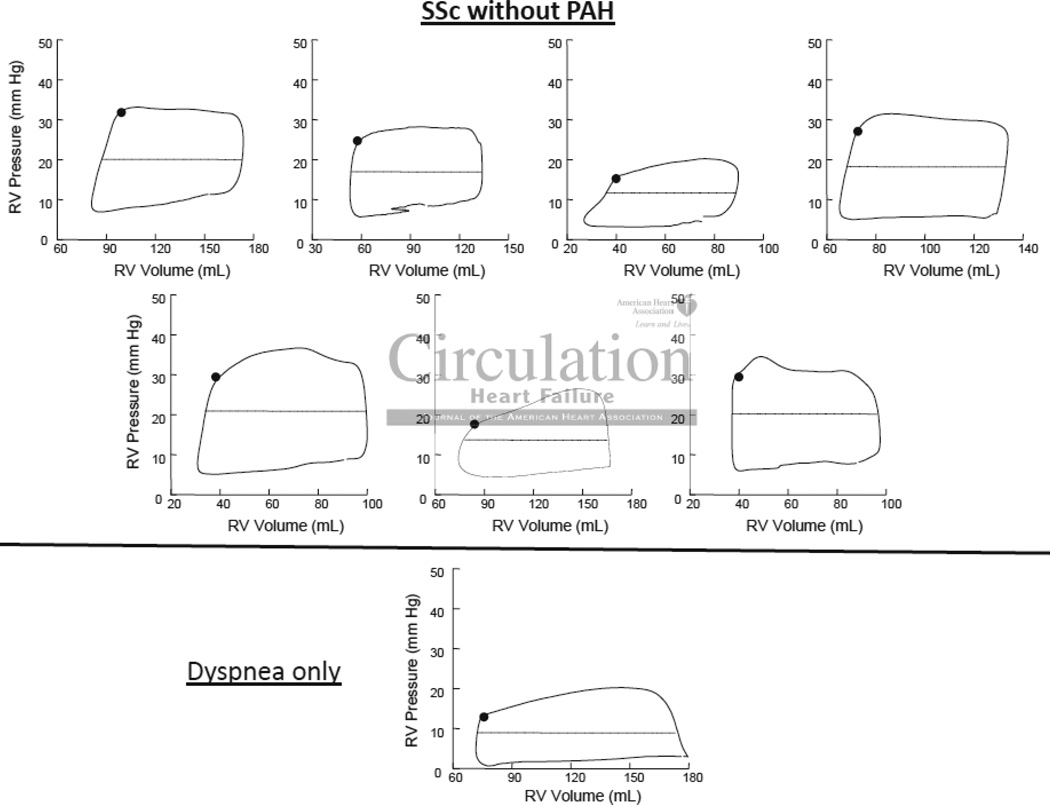
Figure 6.
Steady-State signal-averaged right ventricular (RV) pressure-volume loops for patients without PH, SSc (top, n=7) and without SSc (bottom, n=1). The loops are more rectangular in shape than those in Figure 5, as pressure stays constant or decreases during ejection.

