
Figure 2.
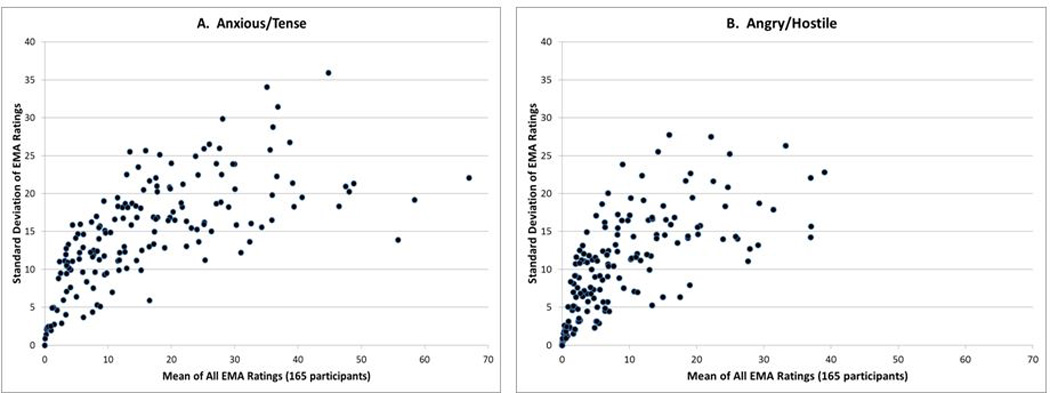
Scatterplots of the positive association of the within-person standard deviation of the untransformed EMA measures with the within-person average, N=165
Official websites use .gov
A
.gov website belongs to an official
government organization in the United States.
Secure .gov websites use HTTPS
A lock (
) or https:// means you've safely
connected to the .gov website. Share sensitive
information only on official, secure websites.
Scatterplots of the positive association of the within-person standard deviation of the untransformed EMA measures with the within-person average, N=165