
Figure 5.
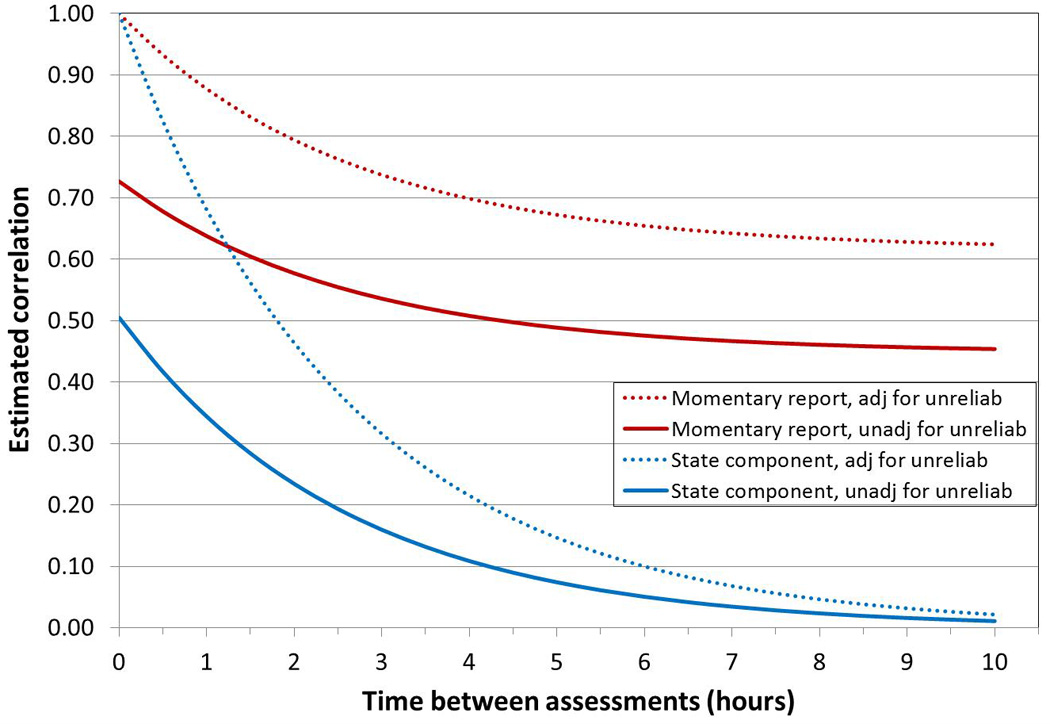
Variograms portraying the dependence of the autocorrelation between two momentary reports from the same person on the time interval between the reports, before and after adjusting for measurement error. The “state component” curves present the same information after subtracting each person’s average score for the monitoring period from their momentary reports.