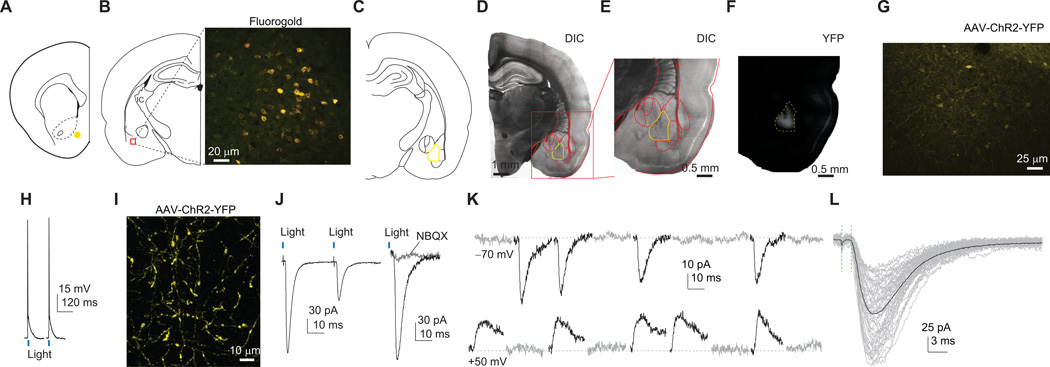
Figure 1. Recording of BLA-to-NAc excitatory synapses.
(A) Diagram showing the position within NAc shell where retrograde tracer FG was stereotaxically injected. (B) Diagram and image showing that NAc shell injection of FG resulted in labeling of BLA neurons. (C) Diagram showing the BLA (circled in yellow), where the ChR2-expressing AAV2 was injected. (D) DIC image showing a brain slice with intra-BLA viral injection. Yellow lines sketch the BLA. (E) Magnified DIC image of a portion of D (red square). (F) YFP image showing fluorescence (viral expression) in the BLA. (G) YPF image showing that intra-BLA injection of ChR2/YFP-expressing virus resulted in expression of ChR2/YFP in neurons and neuronal fibers in the BLA. (H) Example traces showing that optical stimulation elicited action potentials in ChR2-expressing BLA neurons. (I) Example image showing extensive ChR2-expressing fibers in NAc shell in a rat given BLA injection of ChR2/YFP AAV2. (J) Example traces showing elimination of optically-elicited synaptic currents in NAc neurons after perfusion of NBQX. (K) Example EPSCs elicited at BLA-to-NAc synapses by optical stimulations in the minimal stimulation assay showing that failed and successful synaptic responses were readily discernible. (L) Optically evoked individual (gray) and averaged EPSCs (black) from an example NAc neuron showing a short latency of BLA-to-NAc synaptic transmission. Vertical green dashed lines indicate that the latency was measured between the stimulation artifact and initiation of EPSCs. Examples in K and L are taken from saline-experienced control rats (1 day after the end of the training phase).

