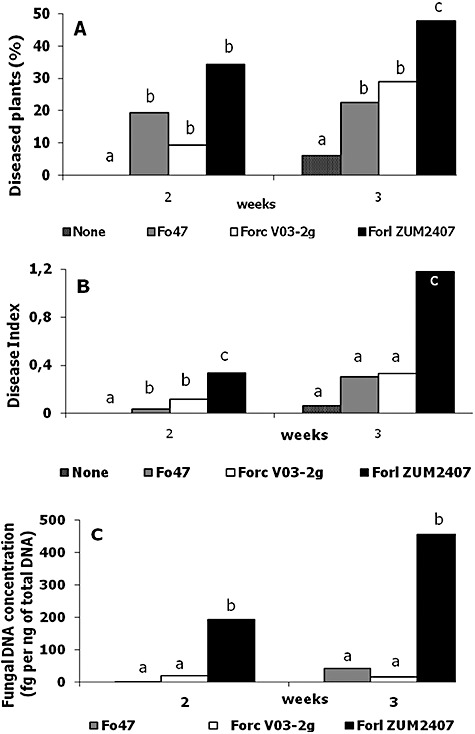
Figure 1.

Quantification of tomato infection by three Fox strains based on the results of two independent experiments. A. Disease level. B. Disease severity index. C. Fungal DNA concentration in tomato plantlets. For statistics, a variance analysis followed by Fisher's least‐significant‐difference test (a = 0.05) was used. Statistically different values are labelled with different letters (a, b and c).
