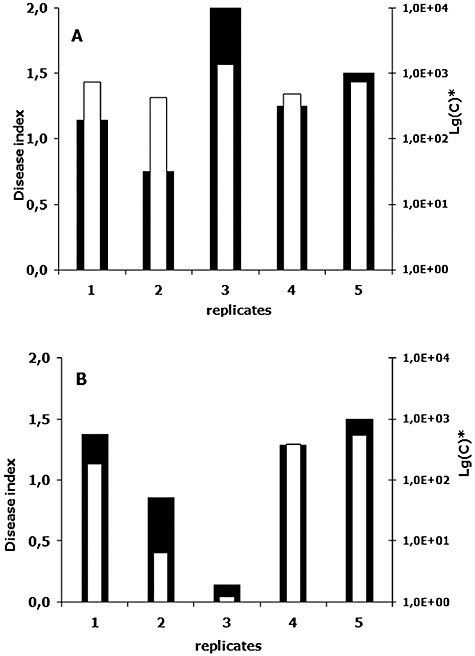
Figure 2.

Comparison of disease severity index and fungal DNA concentration. (A) and (B) represent results of two independent experiments on tomato infection with Forl ZUM2407. Plants were scored 3 weeks after inoculation of the seeds with fungal spores. Black bars correspond to disease index (left y‐axis), white ones show fungal DNA concentration in a logarithmic scale (right y‐axis). Note that in Lg(C) ‘C’ is the fungal DNA concentration in fg per ng of plant DNA.
