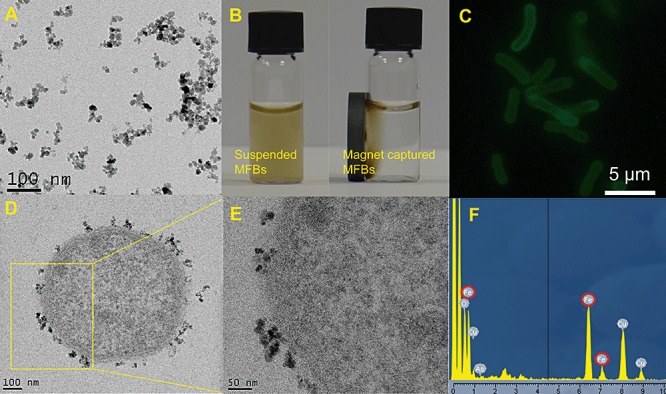
Figure 1.

Characterization of MNPs and MFBs. A. A typical TEM image of aqueous magnetic nanoparticles stabilized with PAAH. B. Magnetic controls on ADPWH_lux MFBs. Originally suspended MFBs (left) were attracted to the side of a permanent magnet (right) after 10 min. C. Epifluorescent microscopy image of cells of Acinetobacter strain ADPWH_lux functionalized with MNPs stabilized with FITC‐PAAH. D and E. TEM images of the thin‐sectioned ADPWH_lux MFBs. F. EDX spectra obtained from the cell shown in (D). Note the iron peaks highlighted by red. The copper signal originates from the copper TEM grid which was used during TEM imaging.
