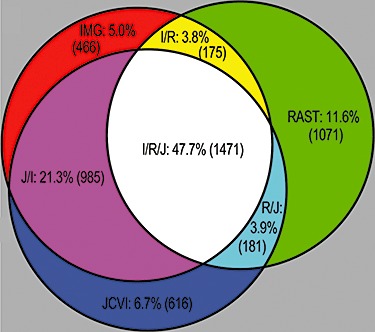
Figure 3.

Venn diagram of comparison of gene prediction in Halorhabdus utahensis using the RAST, IMG and JCVI automated annotation services. The diagram shows the number of predicted protein‐coding genes that share start site and stop site with the other annotations. Overlapping regions indicate genes having exact matches between annotations. Adapted from Bakke and colleagues (2009).
