
Figure 10.
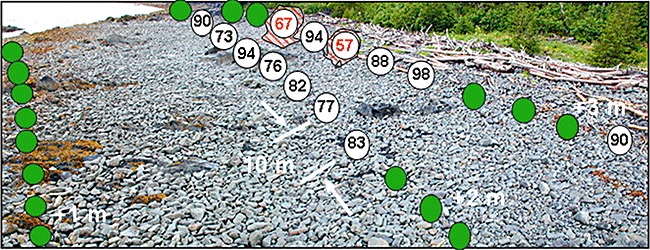
Photo of site SM006B showing the % Total PAH depletion at pits sampled in 2007. All pits along a tidal elevation transect are 10 m apart. Green dots reflect no oiling above reference background. Only two small patches of oil remain that might respond to bioremediation.