Figure 8.

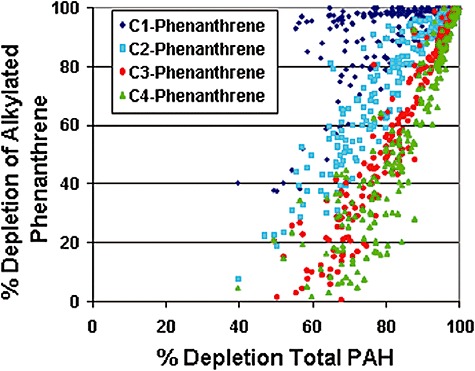
Depletion of C1‐ to C4‐alkylated phenanthrenes versus Total PAH depletion in samples from 2002 to 2007. Pattern is typical of biodegadation.

Depletion of C1‐ to C4‐alkylated phenanthrenes versus Total PAH depletion in samples from 2002 to 2007. Pattern is typical of biodegadation.