
Figure 4.
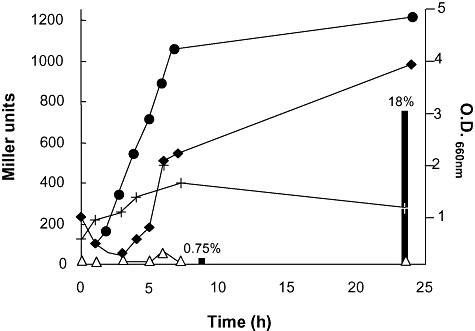
Expression of the cfaB promoter (measured as β‐galactosidase activity) along the P. putida DOT‐T1E growth curve. Circles indicate culture growth. Black diamonds, white triangles and crosses indicate β‐galactosidase activity of pMcfaB, pMP220 without promoter and pMP220 with PttgG::lacZ (promoter of ttgGHI effux pump; Rojas et al., 2003) respectively. Black bars show the percentage of CFAs in the membranes.