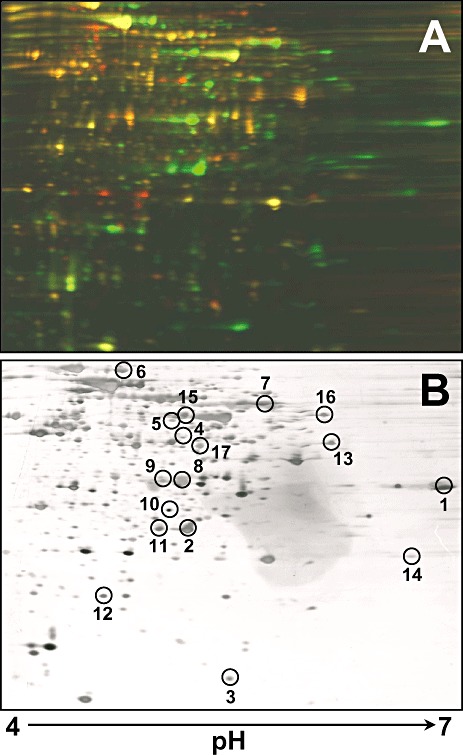
Figure 1.

2D‐DIGE gel analysis of glucose‐ (red spots) versus tetralin‐ (green spots) grown cell proteomes (A) and silver staining of the same gel (B). Fifty micrograms of proteins from each condition was labelled with Cy3 or Cy5. As internal standard, 25 µg of each sample was mixed and labelled with Cy2. Numbered spots were digested in‐gel with trypsin and analysed by MALDI‐MS(/MS) or ESI‐IT for protein identification.
