
Figure 1.
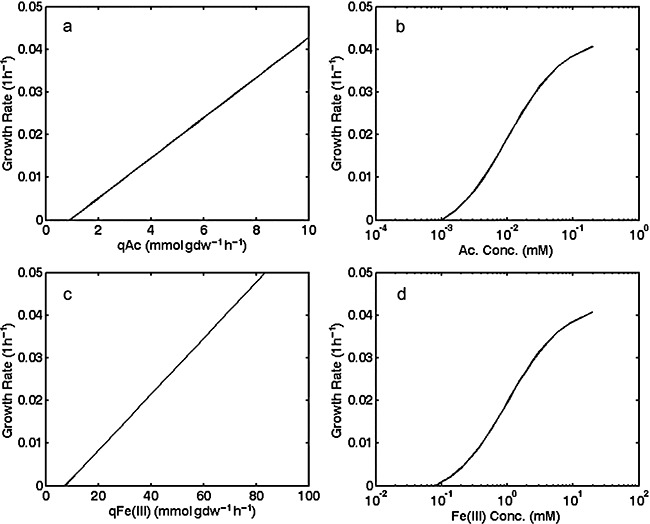
Predictions from genome‐scale model of growth rates at different uptake rates of acetate and Fe(III) and for different acetate and Fe(III) concentrations when acetate or Fe(III) availability is the factor limiting growth. A. Acetate uptake (qAc) as a function of growth rate when acetate is the limiting nutrient. B. Acetate concentration as a function of growth rate when acetate is the limiting nutrient. C. Fe(III) consumption rate [qFe(III)] as a function of growth rate when Fe(III) is the limiting nutrient. D. Fe(III) concentration as a function of growth rate when Fe(III) is the limiting nutrient.