
Figure 4.
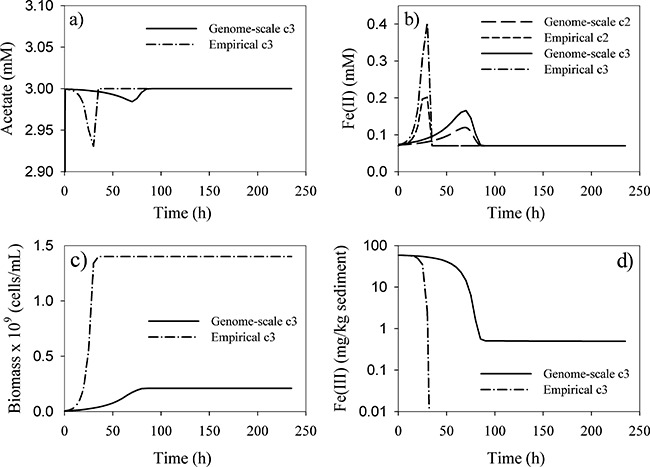
Comparison of simulations of reduction of Fe(III) by G. sulfurreducens in a hypothetical column experiment with acetate as the electron donor. Solid line: coupled genome‐scale metabolic model and geochemical simulation. Dashed lines: simulation with the conventional empirical Monod model. All figures except (b) show simulated concentrations at the column outlet, 15 cm from the inlet of the column. Because of the fast flow and high acetate concentration relative to reaction rates, differences in concentrations along the column axis are negligible in most cases. However, Fe(II) concentrations accumulate along the length of the column as Fe(III) reduction is occurring at similar rates everywhere in the column. Therefore, (b) shows Fe(II) concentrations at two locations: c2 = midpoint of the column (7.5 cm from the inlet); c3 = column outlet (15 cm from the inlet).