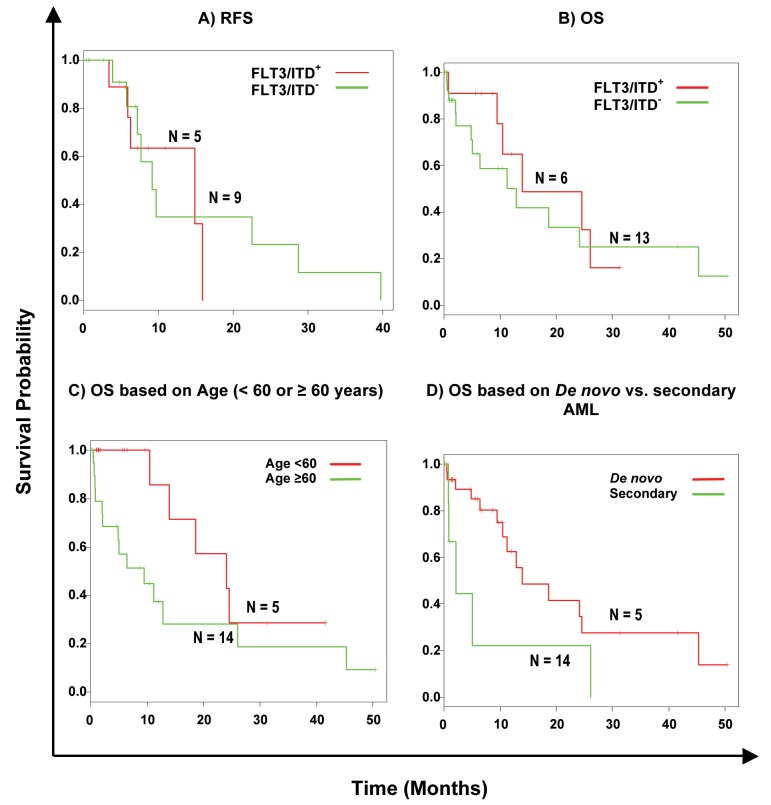
Figure 3.
Kaplan-Meier survival curves of the effect of FLT3/ITDs in AML. Green lines, FLT3/ITD negative samples, red lines FLT3/ITD positive population. Censored cases are marked by a dash. (A) Cumulative RFS of all cases investigated, 13 cases were deleted from the analysis due to "no treatment"; (B) cumulative OS of all cases investigated. (C) OS in patients with and without FLT3/ITD in patients with an age below 60 years and those older or equal to 60 years. (D) OS in patients with and without FLT3/ITD in patients with de novo vs. secondary AML.

