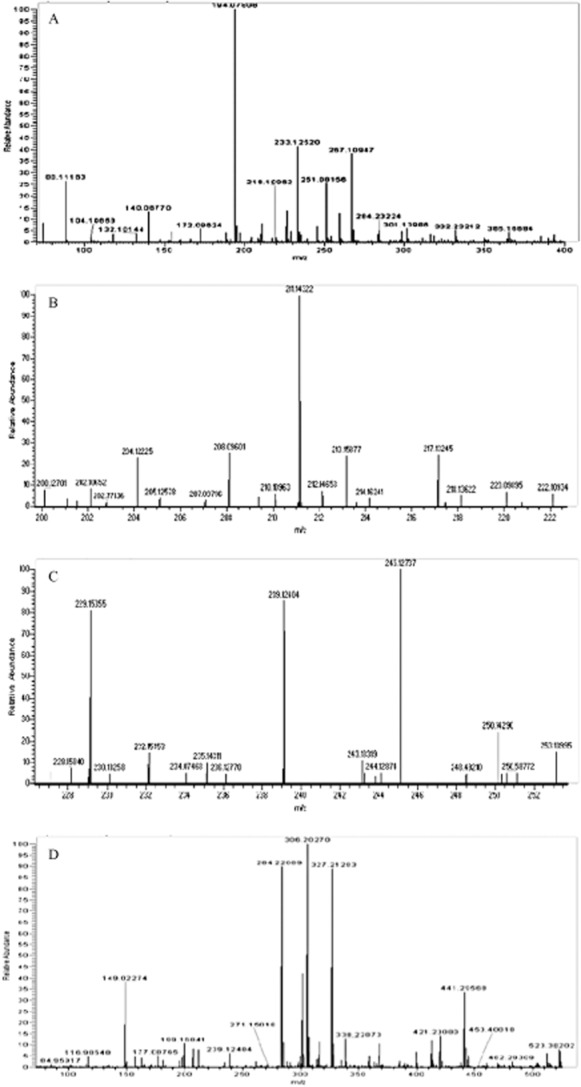
Figure 6.

Mass spectra of ethyl acetate culture supernatant extracts of Aeromonas sp. strain GC1 showing (A) hydrogen and sodium adducts of N‐butanoyl‐l‐homoserine lactone with m/z ratios of 172.096 and 194.078 respectively, (B) hydrogen and sodium adducts of N‐hexanoyl‐l‐homoserine lactone with m/z ratios of 200.127 and 222.109 respectively, (C) hydrogen and sodium adducts of N‐octanoyl‐l‐homoserine lactone with m/z ratios of 228.158 and 250.143 and (D) hydrogen and sodium adducts of N‐dodecanoyl‐l‐homoserine lactone with m/z ratios of 284.221 and 306.203 respectively.
