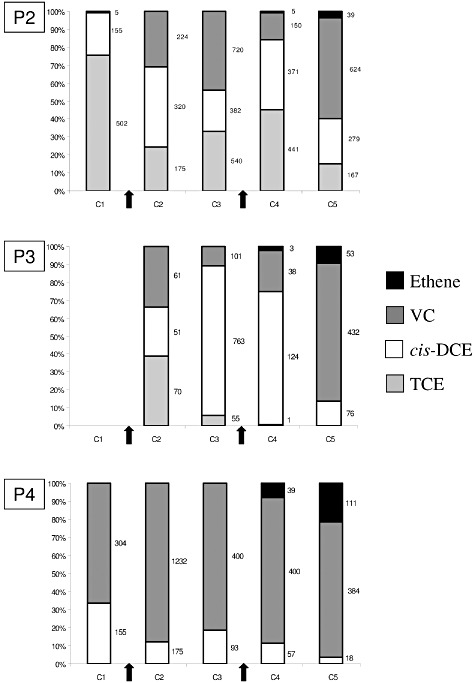
Figure 2.

Chlorinated ethene and ethene trends on site B in the three monitoring wells P2, P3 and P4. Data were provided for sampling periods C1–C5, when available. Proportion of each compound is expressed in percentage. Arrows indicated when lactate injections were realized and numbers at right, the concentration of the different chloroethenes in µmol l−1. NA, data not available.
