Figure 7.

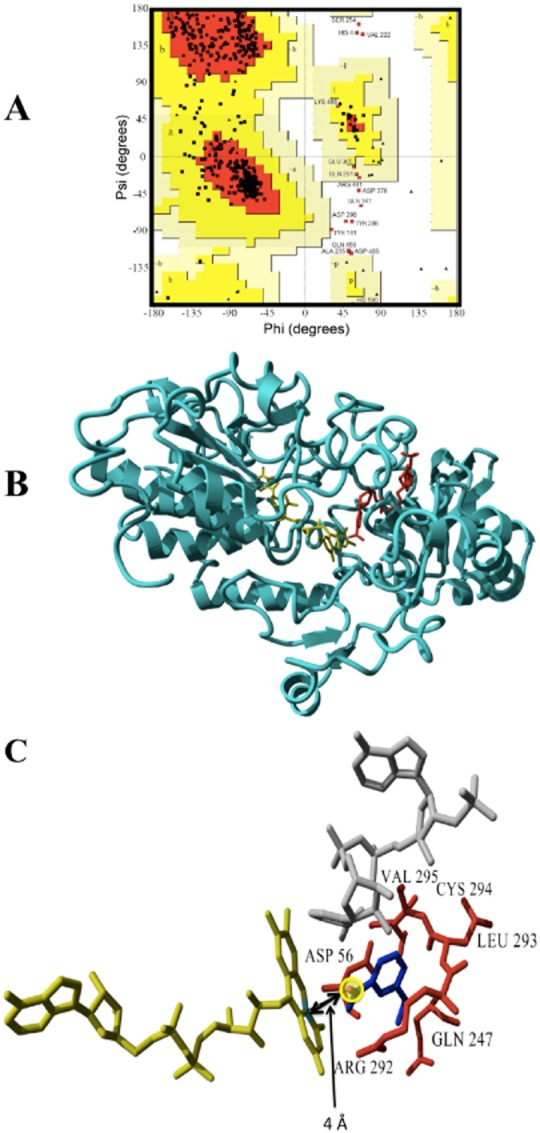
A. Ramachandran plot of the Ar‐BVMO model. The most favoured regions are represented in red, additional allowed regions in dark yellow, generously allowed regions in light yellow.
B. Ribbon representation of the 3D model for the Ar‐BVMO based on the crystal structure of cyclohexanone monooxygenase from Rhodococcus sp. (PDB ID = 3GWF). NADPH and FAD are shown in red and yellow respectively.
C. Docked ethionamide into the active site of Ar‐BVMO model. FAD is shown in yellow, NADPH in grey, the substrate is in dark blue. The S nucleophilic attack site of the ethionamide is highlighted with a yellow circle and the distance (4 Å) from the C4 of the FAD isoalloxazine ring is indicated by a double arrow. Residues interacting with the substrates are labelled and shown in red.
