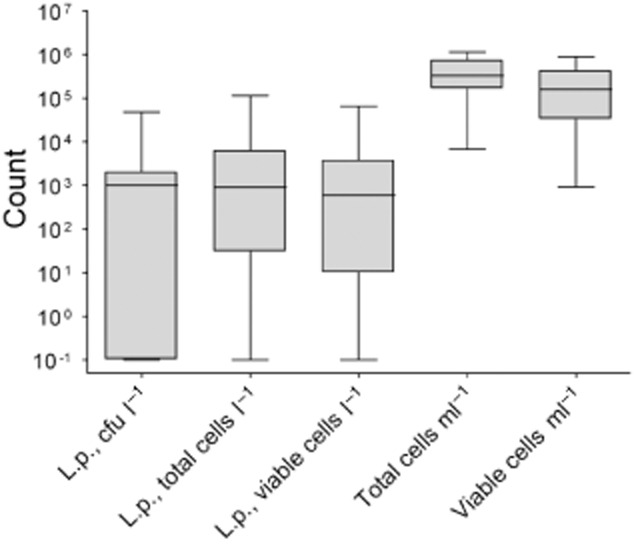
Figure 5.

Box plots of the obtained concentrations for Lp detection by plating and FCM and total (TCC) and viable cell count (VCC). The box represents the first, second (median) and third quartiles, the whiskers represent the maximum and minimum values.
