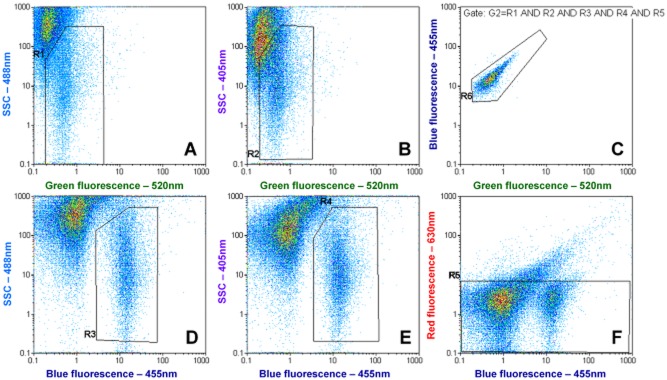
Figure 6.

Typical example of the FCM dot plots for environmental detection of Lp cells in tap water. (A, B, D and E) show the main gates that are applied in combination to (C) to reduce background signals. (F) represents the membrane integrity discrimination approach; since membrane‐damaged Lp cells display a higher red fluorescence due to propidium iodide they move outside the gate and can be discriminated (Fig. S6). The counting is performed in (C).
