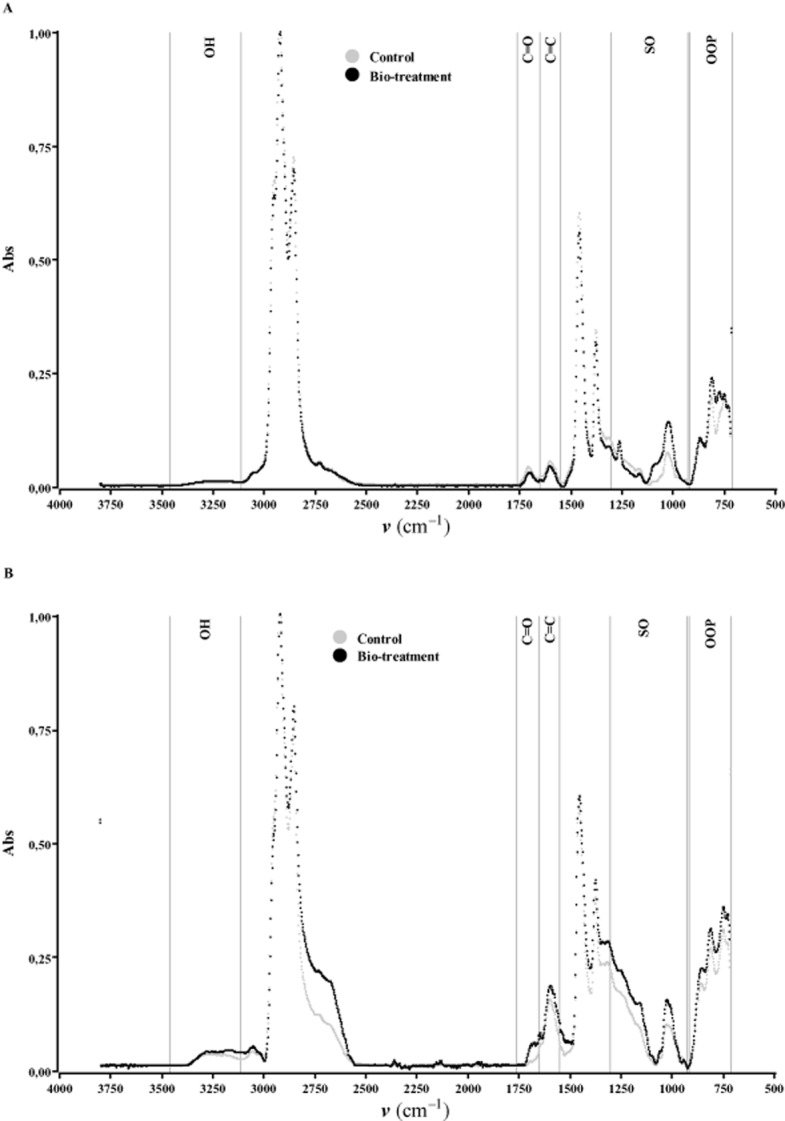
Figure 2.

Comparison of normalized second derivative ATR-FT-IR spectra of maltenes (A) and asphaltenes (B) fractions from biotreated EHCO and non-biotreated EHCO (control). Significant differences (P ≤ 0.05) among biotreatment and control are indicated for the OH (3460–3110 cm−1); C=O (1760–1650 cm−1); C=C (1651–1550 cm−1); SO (1303–930 cm−1); and OOP (915–707 cm−1) regions.
