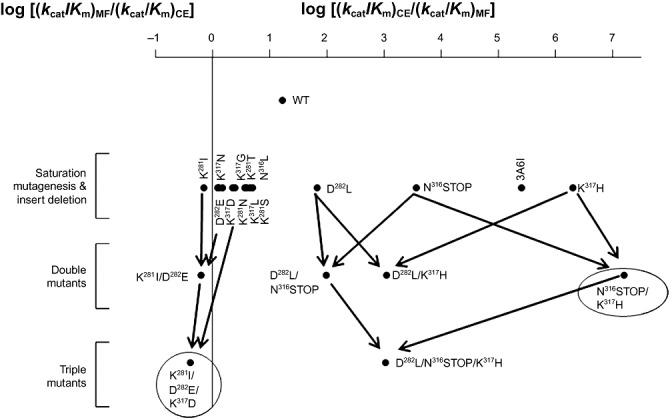
Figure 2.

Schematic representation of the complementary substrate preference of 3A6‐like variants. The preferred substrate specificity of wild‐type and variants are shown as the logarithm of the ratio of catalytic efficiencies (kcat/Km) towards pNPC2 and MF substrates. A value of zero thus represents an enzyme, which is non‐discriminatory between the two substrates.
