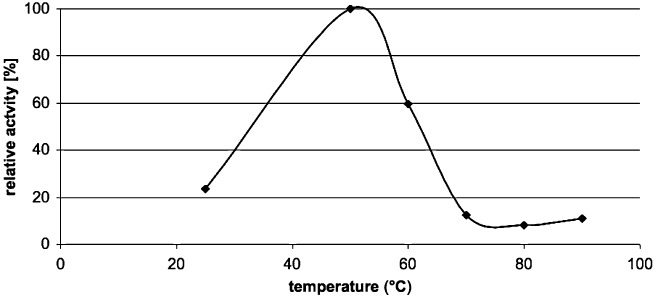
Figure 3.

Activity profile of Est8. Crude cell extracts of E. coli cells expressing Est8 were incubated at the indicated temperatures and analysed spectrophotometrically for the conversion of p‐nitrophenylbutyrate at pH 8.0. The increase in absorbance was followed for 10 min and initial rates were determined. Each experiment was performed in duplicate. The highest activity determined was set to 100%.
