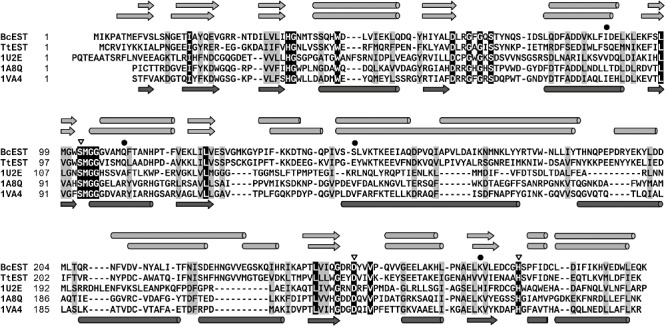
Figure 2.

Multiple sequence alignment of BcEST and TtEST with their closest structural homologues (identified by PBD codes). Identical residues are highlighted black and conserved residues on grey backgrounds. Active‐site catalytic triad residues are marked with a triangle, and mutated residues with a dot. Secondary structure elements are indicated by arrows for β‐strands and by cylinders for α‐helices, as predicted for BcEST and TtEST (shown in light‐grey above the alignment) and observed in the closest structural homologue 1VA4 (shown in dark‐grey below the alignment). For the structural homologues, indicated residue numbers are taken from the respective PDB entries.
