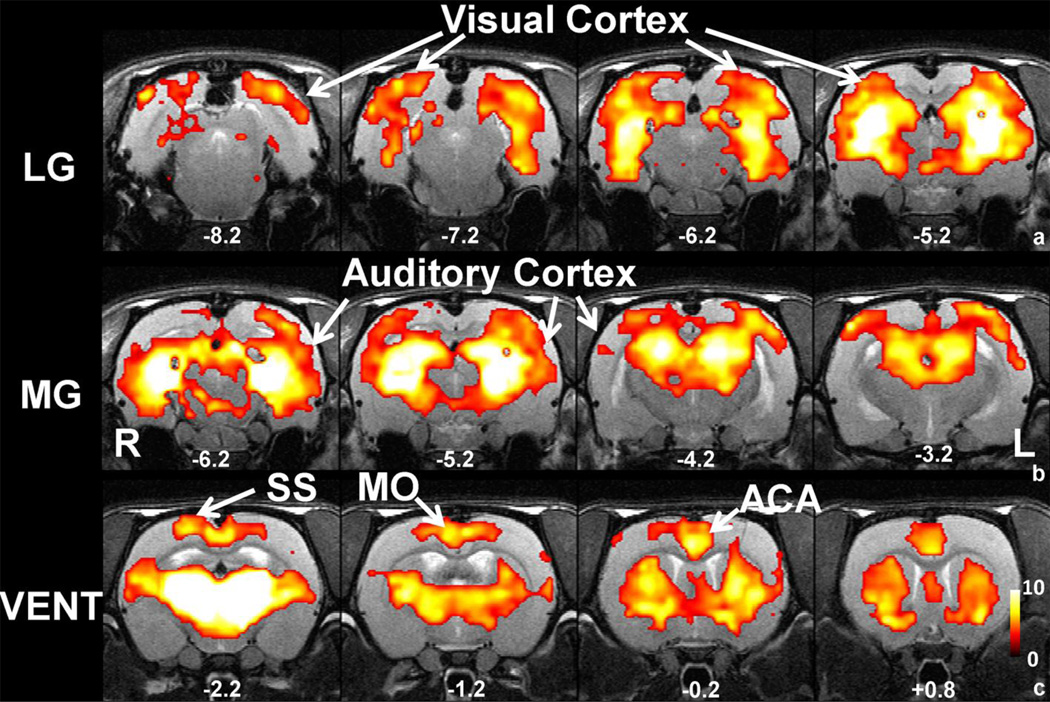
Figure 2.
Functional connectivity maps of sensory-motor related thalamic groups. a) Map of LG connectivity. b) Map of MG connectivity. c) Map of VENT connectivity. All maps were thresholded at p value<0.05, FDR corrected and t values were color coded and displayed. Distance to bregma (in mm) is labeled at the bottom of each slice. L, left, R, right.

