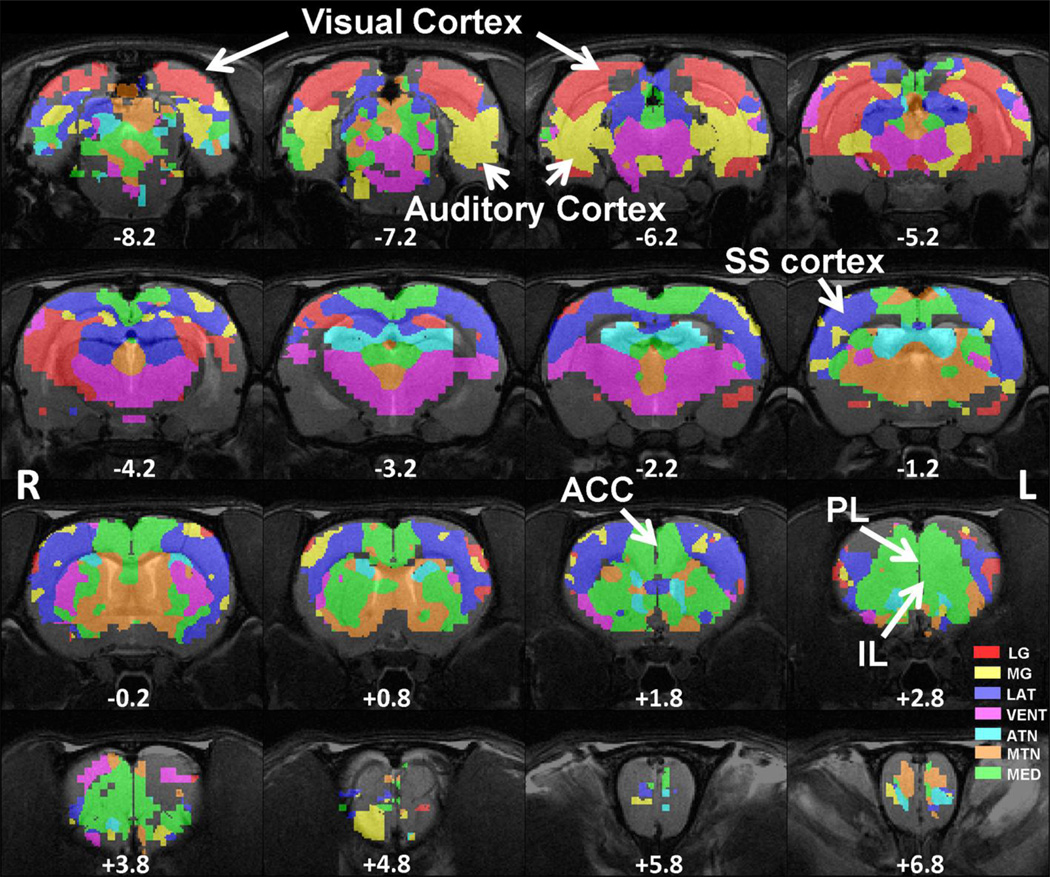
Figure 5.
Multiple thalamocortical networks revealed by the winner-take-all map approach. The color of each voxel was labeled as the color of the winning thalamic nucleus seed. Colors of all thalamic nucleus seeds are identical to those in Figure 1. Distance to bregma (in mm) is labeled at the bottom of each slice. L, left, R, right.

