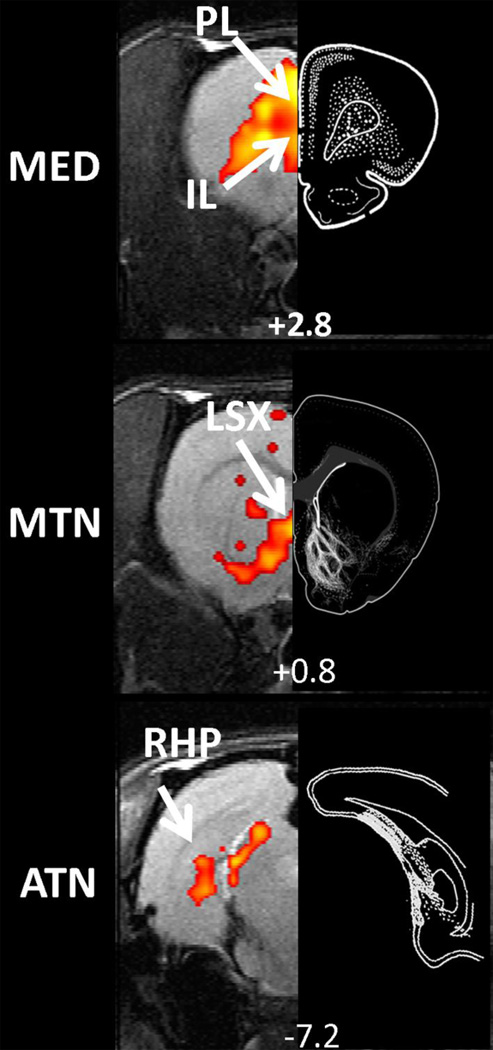
Figure 7.
The spatial patterns of thalamocortical connectivity showed great agreement with the corresponding anatomical connectivity patterns identified in literature tracing studies. Left panels are functional connectivity map obtained by partial correlation analysis. Right panels are adopted from tracing studies with the injections sites originating from mediodorsal nucleus (part of MED, Panel a), paraventriclar nucleus (part of MTN, Panel b), anterodorsal nucleus (part of ATN, Panel c), respectively, in the rat (Krettek and Price, 1977; Van Groen and Wyss, 1995; Vertes and Hoover, 2008). White dots or lines indicated labeled neurons in destination regions.

