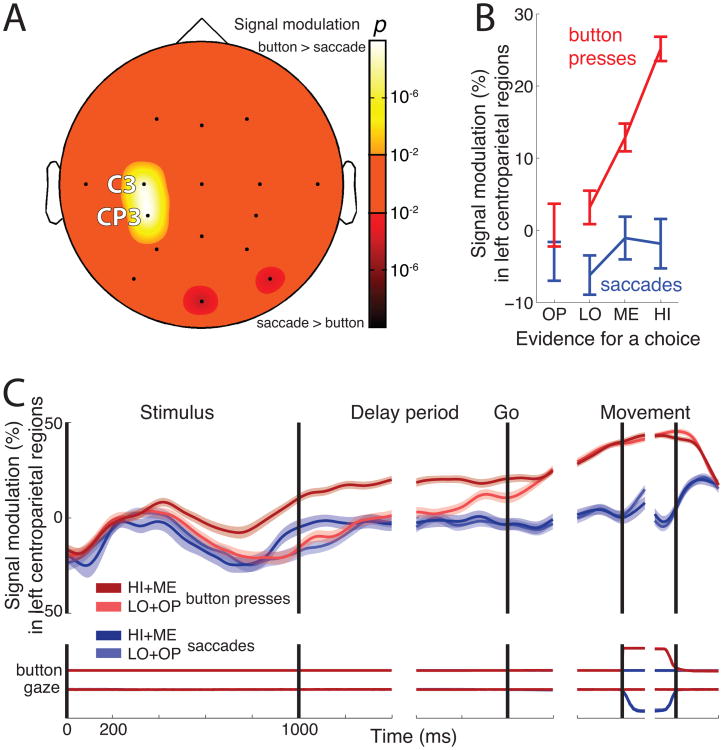
Figure 2.
Human centroparietal cortex reflects the dynamics of a perceptual decision process
(A) Topography of the choice effect, i.e., the significance of the difference between desynchronization on button press versus saccade trials during the delay period. The bright colors represent locations at which neural activity is more desynchronized for button presses compared to saccades. The dark colors represent the converse.
(B) Mean±SEM neural desynchronization at C3 and CP3 during the delay period as a function of decision evidence, separately for button press choices (red), and saccade choices (blue).
(C) Mean±SEM desynchronization at C3 and CP3 as a function of time. Data are shown separately for button press choices (red) and saccade choices (blue), and choices for which evidence was either strong (dark) or weak (light)—see inset. Desynchronization was measured in 100 ms periods overlapping by 1 sample (3.9 ms). The bottom part of the plot shows the mean±SEM button press and eye gaze signals, respectively.

