Figure 5.
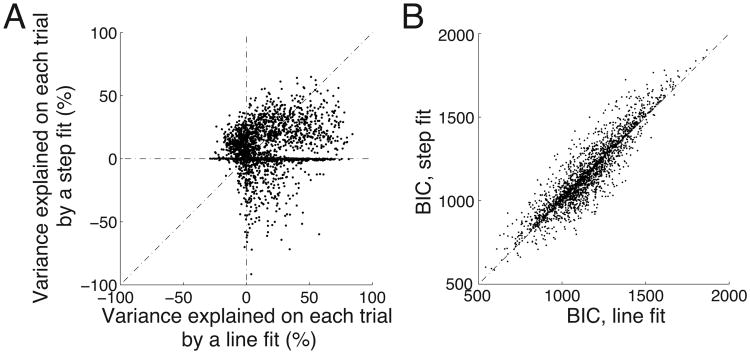
Line fit explains the early ramping activity during the stimulus period on each trial better than a step fit.
(A) Variance explained on each trial in the neural signal during the stimulus period. The figure compares, for each trial, the variance explained by a line fit (abscissa) versus variance explained by a step fit (ordinate)—see text for details. The line fit explains substantially more variance (mean R2 = 0.16) than the trial-wise step fit (mean R2 = 0.08).
(B) The Bayesian information criterion (BIC) computed for the same data as in A. The line fit model is associated with a significantly smaller BIC (see text), and thus represents a better fit to the data than the step fit model.

