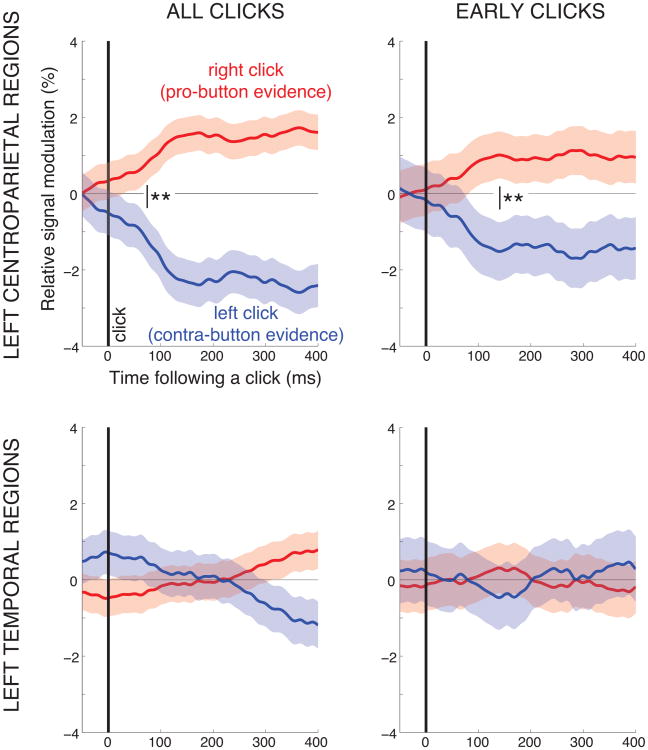
Figure 6.
The neural signal encodes the polarity of each element of decision evidence. Each trace gives the mean±SEM change of the neural signal following a right click (red) and a left click (blue), relative to average response to all clicks, for all trials that result in a button-press. The top panels give the responses in the left centroparietal regions considered previously in the paper (channels C3 and CP3). The bottom panels give the responses in left temporal regions (channel T7). The left panels include all clicks during the stimulus period. The right panels include clicks that occur within the first 400 ms of the stimulus period. The thick vertical line at time 0 marks the occurrence of a click. The thin vertical line with the two stars indicates the time when the red and blue curves start to significantly differ (p < 0.01, two-tailed t-test). As elsewhere in the paper, the desynchronization of the neural signal was measured in 100 ms windows, 1 sample (3.9 ms) overlap.

