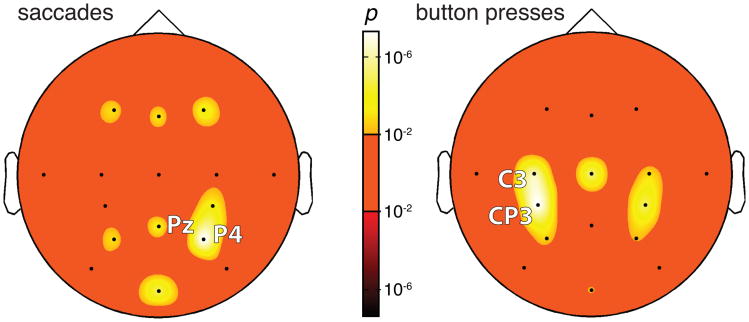
Figure 9.
Whole-brain analysis of the representation of decision evidence. The significance of the effect of decision evidence is rendered in color for each channel, separately for saccade choices (left) and button press choices (right). The bright (dark) hues of the color bar indicate cases for which the effects are positive (negative), that is, where stronger evidence is significantly associated with more (less) desynchronization. For both saccades (left) and button presses (right), the effect is not negative for any channel. For saccades, the effect of decision evidence is strongest at parietal channels P4, Pz. For button presses, the effect is strongest at motor channels CP3. The significance values are corrected for the number of channels (i.e., 16) and for the number of observations (i.e., 2)—by a factor of 32.

