
Figure 5.
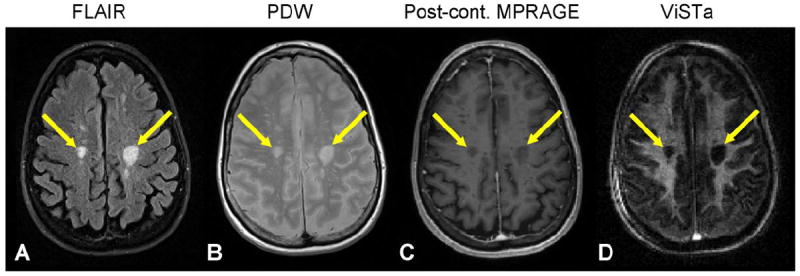
FLAIR (A), PDW (B), post-contrast MPRAGE (C), and single-echo ViSTa (D) images from an MS patient. Chronic lesions (arrows) show significant signal reduction in the ViSTa image.
Official websites use .gov
A
.gov website belongs to an official
government organization in the United States.
Secure .gov websites use HTTPS
A lock (
) or https:// means you've safely
connected to the .gov website. Share sensitive
information only on official, secure websites.
FLAIR (A), PDW (B), post-contrast MPRAGE (C), and single-echo ViSTa (D) images from an MS patient. Chronic lesions (arrows) show significant signal reduction in the ViSTa image.