
Figure 1. Masks used as seed regions for connectivity analysis.
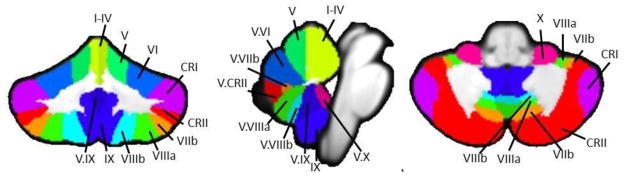
The 17 lobular regions, as defined by the SUIT atlas (Diedrichsen, 2006; Diedrichsen et al., 2009) overlaid on a coronal (left), midsaggital (center), and axial (left) slices. Labels indicate the right hemisphere and vermal seeds used in this analysis. Adapted from Bernard and Seidler (In Press), Figure 1.