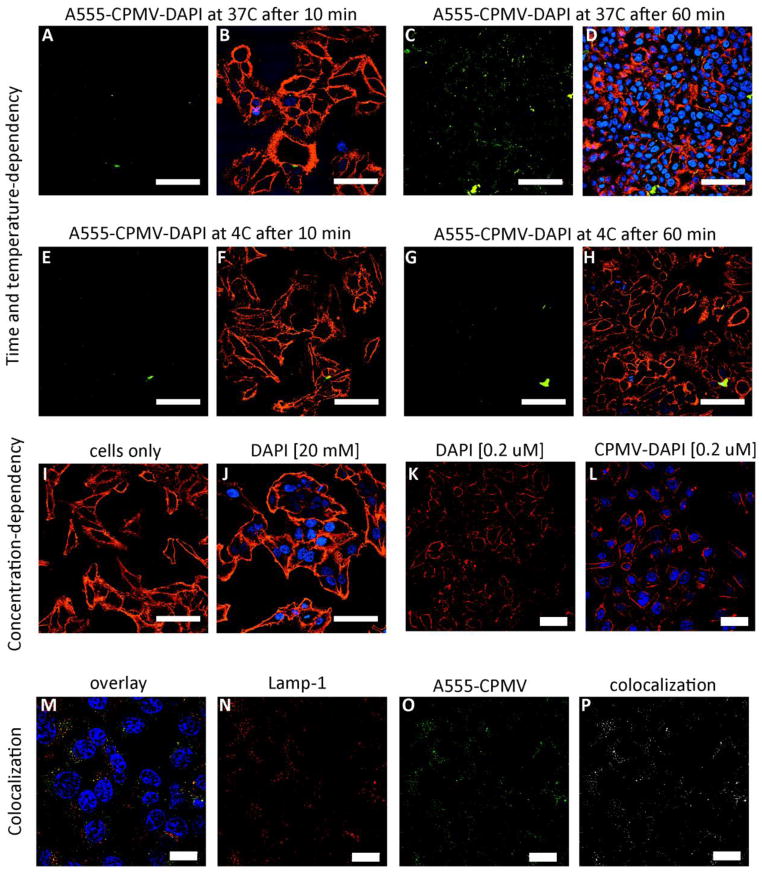
Figure 3.
The fate of CPMV-DAPI in HeLa cells. Time and temperature-dependency: CPMV-DAPI was incubated with HeLa cells at 4°C versus 37°C for 10 min versus 60 min. A, C, E, G = CPMV channel (in green), B, D, F, H = overlay of CPMV channel (in green), cell membrane stain (WGA, in red), and DAPI in blue. Concentration dependence: I-L showing cells after incubation with different concentrations of free DAPI versus CPMV-DAPI, cell membrane in red, DAPI in blue (no CPMV staining). Colocalization: M = overlay of DAPI in blue (note in this experiment cells were stained using free DAPI, and not DAPI delivered through CPMV), endolysosomes (Lamp-1 marker) in red, and CPMV in green, N = Lamp-1 only in red, O = CPMV only in green, P = colocalization analysis using ImageJ and colocalization highlighter plug-in, colocalized signals are shown in white. The scale bars are 50 μm in length.

