Figure 4.

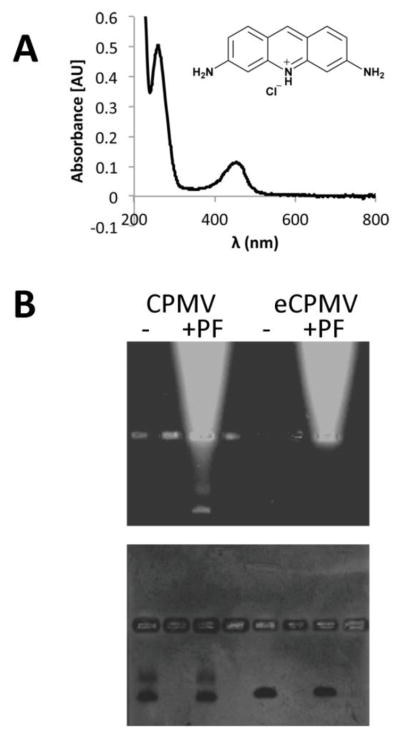
Characterization of drug-loaded CPMV. A) UV/visible spectroscopy of CPMV-PF showing the CPMV and proflavine-specific absorbance maxima at 260 nm and 450 nm. B) Native gel electrophoresis of CPMV and eCPMV with and without proflavine (PF) (it should be noted that non-purified samples were analyzed on the gel to show the migration pattern of free PF versus (e)CPMV); gels were documented under UV light, and then stained with Coomassie blue and photographed under white light. The bright bands in proflavine-positive samples indicate free dye that migrates towards the cathode in the electrophoretic field (on top).
