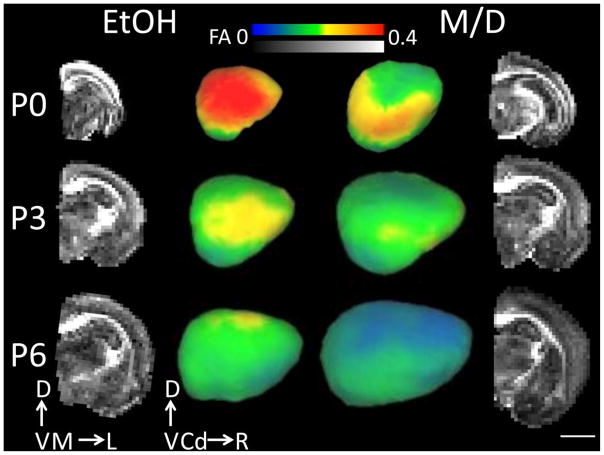
Figure 1.
The two middle columns of images are laterally-facing mid-cortical surface models of one rat postnatal day (P)0, P3 and P6 right hemisphere for each treatment group (ethanol (EtOH) and maltose/dextrin (M/D)), on which cortical FA at each mid-cortical surface node is projected. The outer columns represent mid-coronal FA maps for the right hemisphere of the same subjects depicted in the middle columns. Cortical FA decreased significantly with age. Additionally, cortical FA was largest, and isocortical volume smallest, in the EtOH group compared to the M/D group. This group difference is most visible in the outer layers of the cortex. Error bars represent one standard error. Scale bar is 4 mm. D = dorsal, V= ventral, M = medial, L= Lateral, Cd = Caudal, R = Rostral.

