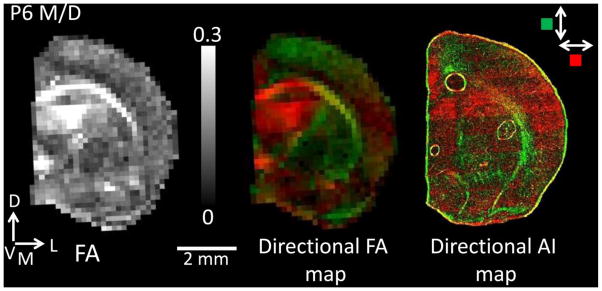
Figure 3.

An FA map for one P6 M/D subject is shown on the left corresponding to the directional FA map (center). The directional FA map is shown for the same section with only the in-plane orientation for direct comparison with the directional AI map (far right), which is necessarily constrained in two dimensions. Green color indicates tissues oriented in a dorsal-ventral direction, while red indicates a medial-lateral direction. Please note that while blue coloring is typically used to represent water diffusion anisotropy oriented in the dorsal – ventral plane (e.g. Huang et al. 2008), green coloring was substituted here to increase contrast for visualization purposes. There is a close correspondence between the directional FA and AI maps.
