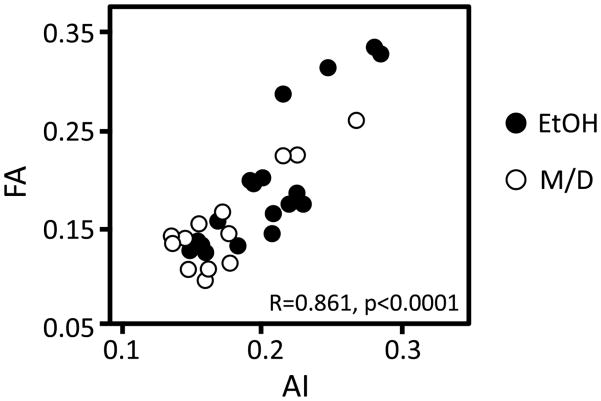
Figure 4.
A regression analysis investigating the relationship between AI and FA resulted in a significant direct overall association between AI and FA (p < 0.001). This relationship was also significant in both treatment groups separately (EtOH p < 0.0001, M/D p < 0.0001). This suggests that the morphological characteristics of neurons, represented by AI, underly FA meausurements in the developing cerebral cortex, and that this is true in both normal as well as FASD development.

