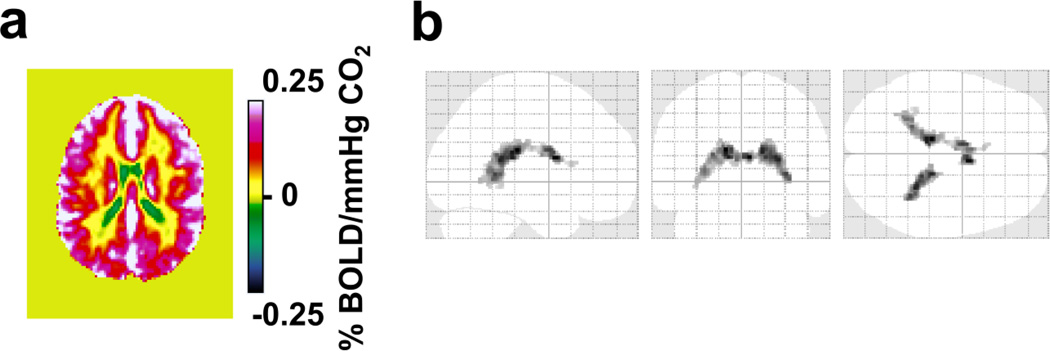
Figure 2.
BOLD-CVR response to hypercapnia from data in Study 2. (a) Group-averaged CVR map (N=10) in a representative slice (z=47 in MNI template) illustrating regions with apparently negative CVR values (cold color). (b) Voxels with significantly negative CVR (FDR corrected p<0.05) as detected from the BOLD hypercapnia data in Study 2.

