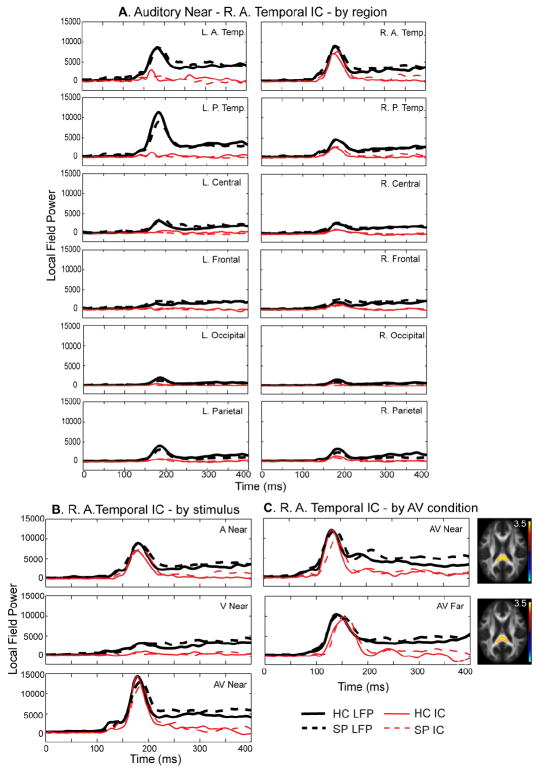
Fig. 3.
Right Temporal 100-200 ms MEG Component. A. MEG right temporal component across MEG local field power (LFP) regions. The response to the auditory Near stimulus for each of the 12 regions is shown in bold black lines (healthy controls – solid, schizophrenia patients – dashed). By focusing on just one component (red lines) across the MEG waveform regions, it is clear that this component is specific to the peak shown in sensors located over the right anterior and right posterior temporal (R. A. Temp and R. P. Temp) lobes. R. L. P. Temp. = right/left posterior temporal, Occ. = occipital. B. R. A. Temp LFP across conditions. The top plot is the same as that shown in 3A (Near auditory – A Near). In addition, the responses to the Near visual (V Near) and Near multisensory (AV Near) are shown for the same region. As expected, there is no considerable early response in this region during the V Near condition. Also, the same component explains the early peak in the right temporal channel group during the AV condition. C. Right temporal component across Near/Far fusion analyses. The fusion analysis was performed separately for the different multisensory conditions AV Near/Far. We found good agreement in components across the analyses as demonstrated in this plot. Consistent fractional anisotropy (FA) maps were identified for this right temporal component showing increased FA primarily in the splenium of the corpus callosum. In addition this component consistently explained the first prominent peak seen over right temporal cortex.

