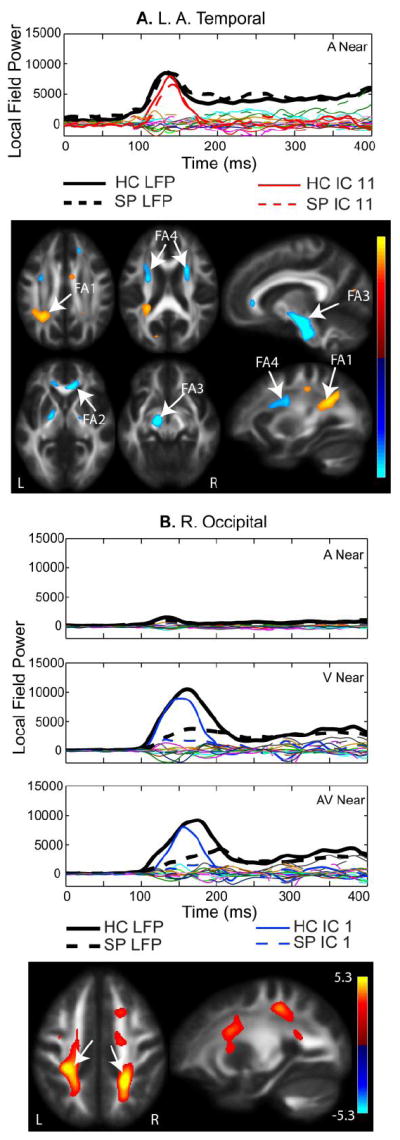
Fig. 4.

A. Left Anterior Temporal 100-200 ms IC. MEG component for the Near auditory condition is shown. All components from the independent component analysis (ICA) are plotted. The average MEG LFP response for the left anterior temporal region is shown in bold black lines (healthy controls – solid, schizophrenia patients– dashed). The independent component denoted in red is described as the left temporal component, based on the spatial specificity to this MEG region. The fractional anisotropy (FA) map shows increased FA in the left parietal lobe associated with posterior regions of the anterior/posterior association fiber tracts (FA region 1), the genu of the corpus callosum (FA2), the cortico-spinal tract (FA3), and anterior regions that overlap with projection and association fiber tracts (FA4). B. Occipital IC. The IC loading factors for this component were significantly different with HC having larger loading parameters than SP, which corresponds to greater FA bilaterally in the parietal cortex corresponding to the posterior region of the anterior/posterior association fiber tracts (see arrows). Similar to the right temporal component shown in Fig. 3B, the occipital component consistently explained the first prominent peak seen in the channels over left and right occipital cortex. In this case, occipital activity was not divided into left/right occipital components.
